3. Perform Static Malware Analysis
Static Malware Analysis, also known as code analysis, involves going through the executable binary code without executing it to gain a better understanding of the malware and its purpose.
1. Perform Malware Scanning using Hybrid Analysis
You can upload a file and it will peform the analysis.
You can also use other local and online malware scanning tools such as Any.Run (https://app.any.run) Valkyrie Sandbox (https://valkyrie.comodo.com), JOESandbox Cloud (https://www.joesandbox.com), Jotti (https://virusscan.jotti.org) to perform online malware scanning.
2. Perform Strings Search using BinText
Open file in bintext and make sure that advanced option is set. Click on Go


3. Identify Packaging and Obfuscation with PEid
Attackers often use packing and obfuscation or a packer to compress, encrypt, or modify a malware executable file to avoid detection. Obfuscation also hides the execution of the programs. When the user executes a packed program, it also runs a small wrapper program to decompress the packed file, and then runs the unpacked file. It complicates the task of reverse engineers to determine the actual program logic and other metadata via static analysis. The best approach is to try and identify if the file includes packed elements and locate the tool or method used to pack it. PEid is a free tool that provides details about Windows executable files. It can identify signatures associated with over 600 different packers and compilers. This tool also displays the type of packer used in packing a program.

4. Analyze ELF executable with Detect it Easy (DIE)
The Executable and Linkable Format (ELF) is a generic executable file format in Linux environment. It contains three main components including ELF header, sections, and segments. Each component plays an independent role in the loading and execution of ELF executables. The static analysis of an ELF file involves investigating an ELF executable file without running or installing it. It also involves accessing the binary code and extracting valuable artifacts from the program. Numerous tools can be used to perform static analysis on ELF files. In this task, we will be using Detect It Easy (DIE) tool to analyze ELF file. Detect It Easy (DIE) is an application used for determining the types of files. Apart from the Windows, DIE is also available for Linux and Mac OS. It has a completely open architecture of signatures and can easily add its own algorithms for detecting or modifying the existing signatures. It detects a file's compiler, linker, packer, etc. using a signature-based detection method.

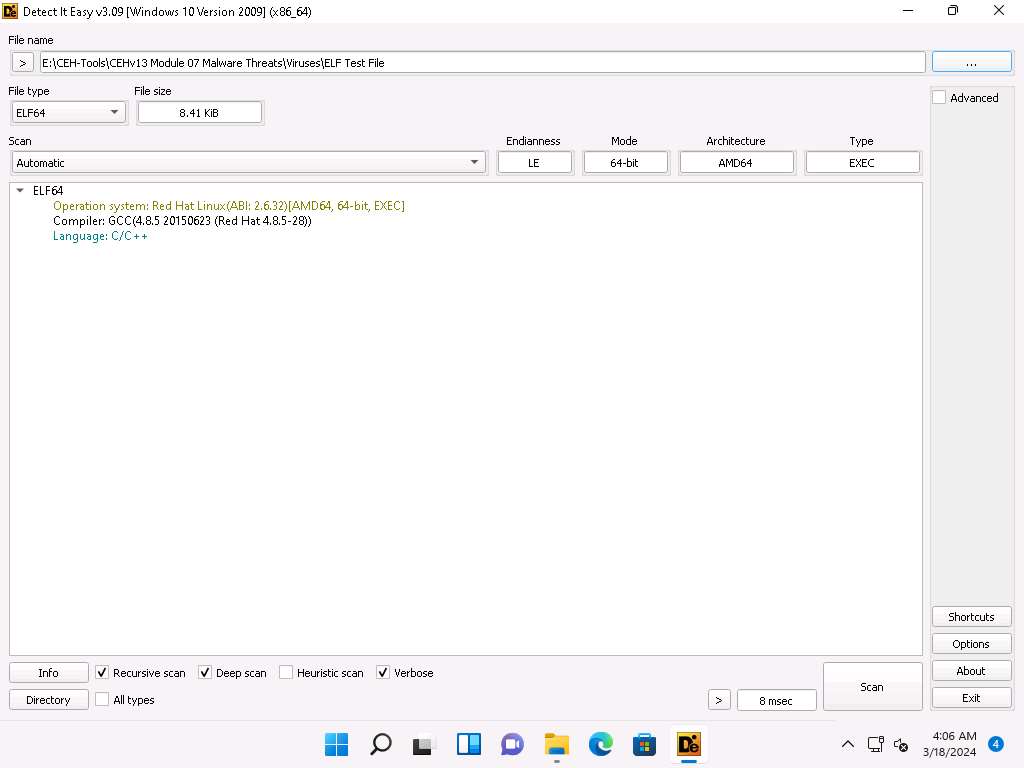
Detect It Easy automatically scans the file and result appears showing the Operating system, compiler and language details in the middle pane, as shown in the screenshot.
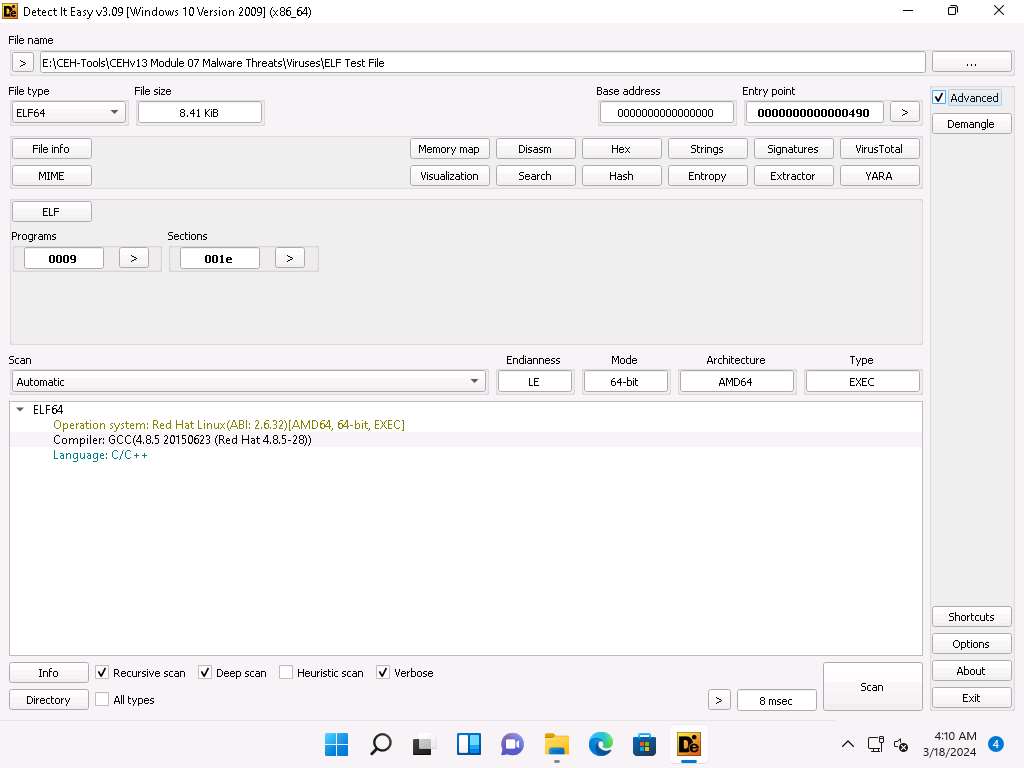
Screenshot Now, check the Advanced checkbox present at the right pane.
Screenshot Click File info button from the top left corner of the window. Info window appears, you can observe information such as File name, size, MD5, SHA1, Entropy, entry points, etc.
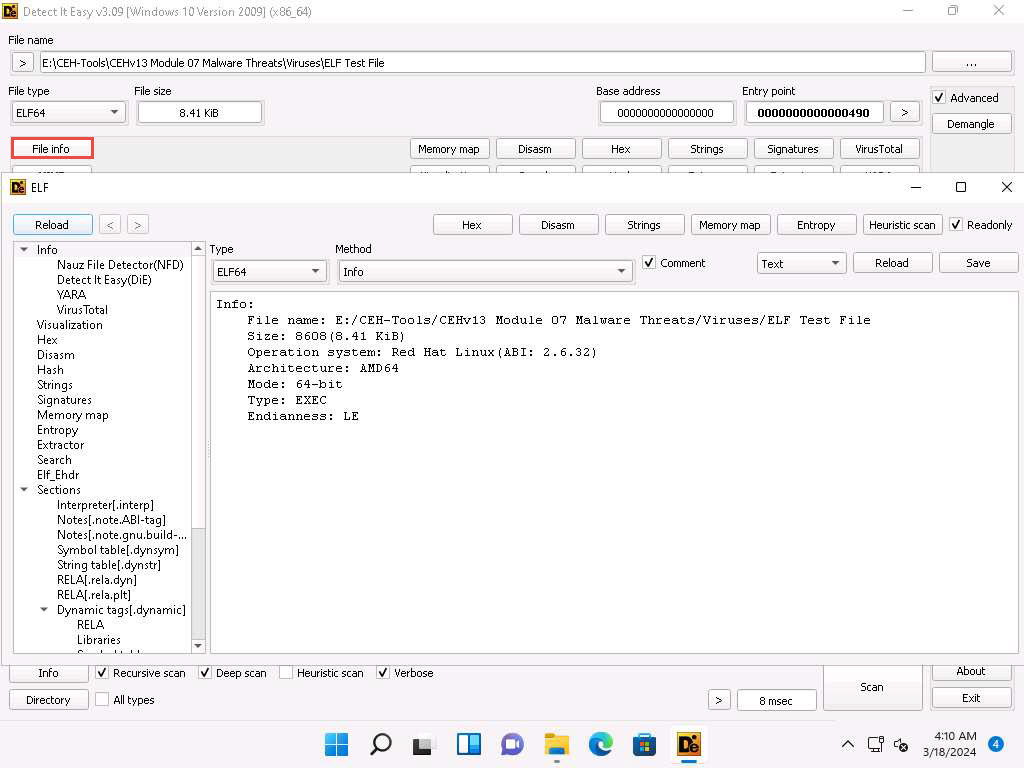
di1.jpg After viewing the information, close the window.
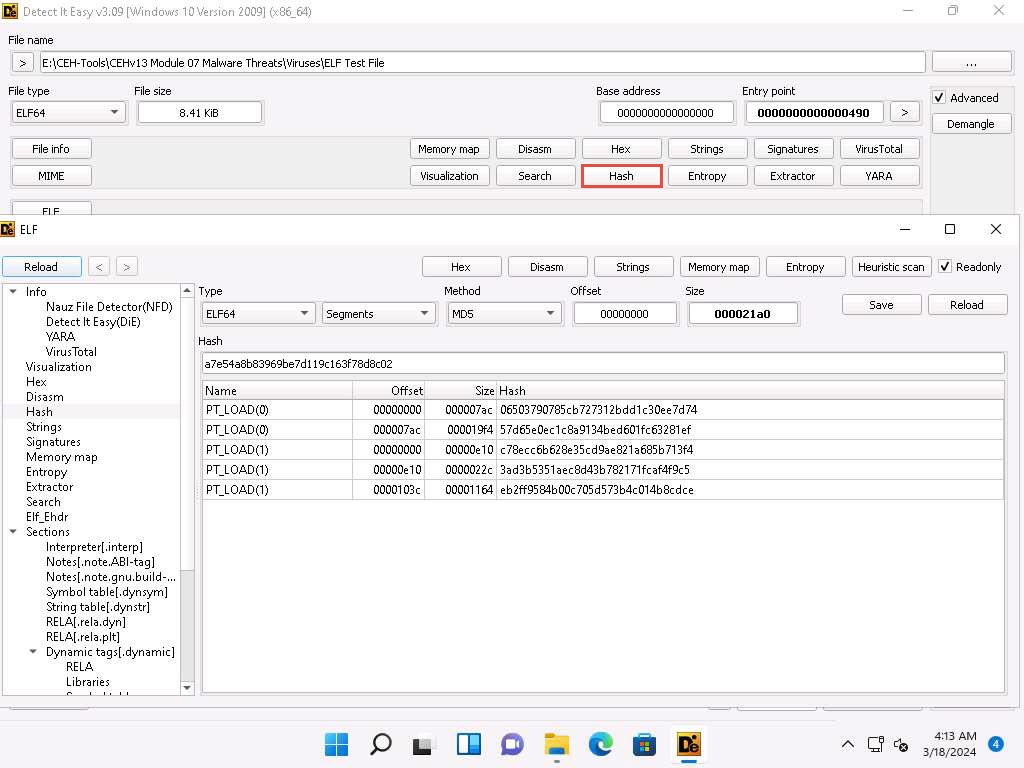
Similarly, click Hash button from the top right corner of the window to view the information related to hash. Close the window after viewing the information.
di2.jpg Click Entropy button from the top right corner of the window. Here, you can observe the status, size and graph of entropy. Close the window after viewing the Entropy information.
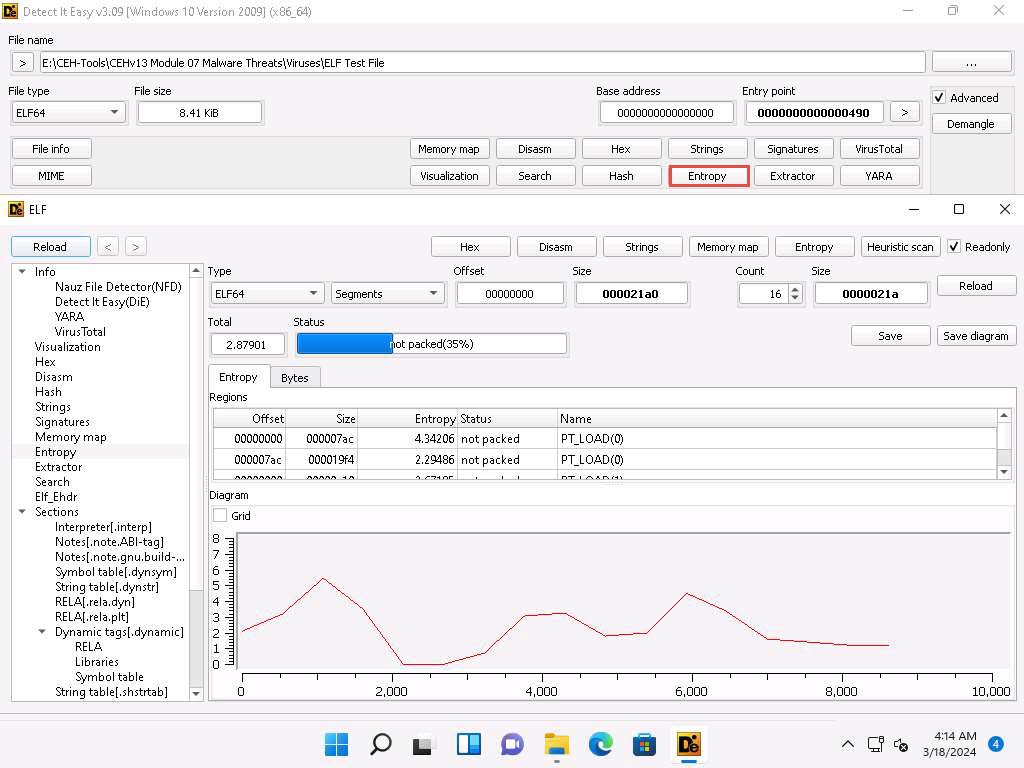
di3.jpg Similarly, you can further explore other functions such as MIME, Hex, Signatures and Demangle.
5. Find the portable executable information with PE Explorer
The Portable Executable (PE) format is the executable file format used on Windows OSes that stores the information a Windows system requires to manage the executable code. The PE stores metadata about the program, which helps in finding additional details of the file. For instance, the Windows binary is in PE format that consists of information such as time of creation and modification, import and export functions, compilation time, DLLs, and linked files, as well as strings, menus, and symbols. PE Explorer lets you open, view, and edit a variety of different 32-bit Windows executable file types (also called PE files) ranging from common such as EXE, DLL, and ActiveX Controls to less familiar types such as SCR (Screensavers), CPL (Control Panel Applets), SYS, MSSTYLES, BPL, DPL, and more (including executable files that run on MS Windows Mobile platform).
6. Identify file dependencies using Dependency Walker
Any software program depends on the various inbuilt libraries of an OS that help in performing specified actions in a system. Programs need to work with internal system files to function correctly. Programs store their import and export functions in a kerne132.d11 file. File dependencies contain information about the internal system files that the program needs to function properly; this includes the process of registration and location on the machine. Find the libraries and file dependencies, as they contain information about the run-time requirements of an application. Then, check to find and analyze these files to provide information about the malware in the file. File dependencies include linked libraries, functions, and function calls. Check the dynamically linked list in the malware executable file. Finding out all library functions may allow guessing about what the malware program can do. You should know the various DLLs used to load and run a program. Some of the standard DLLs are:


7. Malware disassembly using IDA and OllyDbg
Static analysis also includes the dismantling of a given executable into binary format to study its functionalities and features. This process helps identify the language used for programming the malware, look for APIs that reveal its function, and retrieve other information. Based on the reconstructed assembly code, you can inspect the program logic and recognize its threat potential. This process uses debugging tools such as IDA Pro and OllyDbg.
IDA As a disassembler, IDA explores binary programs, for which the source code might not be available, to create maps of their execution. The primary purpose of a disassembler is to display the instructions actually executed by the processor in a symbolic representation called “assembly language.” However, in real life, things are not always simple. Hostile code usually does not cooperate with the analyst. Viruses, worms, and Trojans are often armored and obfuscated; as such, more powerful tools are required. The debugger in IDA complements the static analysis capabilities of the disassembler. By allowing an analyst to single-step through the code being investigated, the debugger often bypasses the obfuscation. It helps obtain data that the more powerful static disassembler will be able to process in depth.
OllyDbg OllyDbg is a debugger that emphasizes binary code analysis, which is useful when source code is unavailable. It traces registers, recognizes procedures, API calls switches, tables, constants, and strings, and locates routines from object files and libraries.
There is a new debugging option, “Set permanent breakpoints on system calls.” When active, it requests OllyDbg to set breakpoints on KERNEL32.UnhandledExceptionFilter(), NTDLL.KiUserExceptionDispatcher(), NTDLL.ZwContinue(), and NTDLL.NtQueryInformationProcess().
Launch IDA Freeware 8.4.
The IDA: Quick start pop-up appears; click on New to select a malicious file for disassembly.
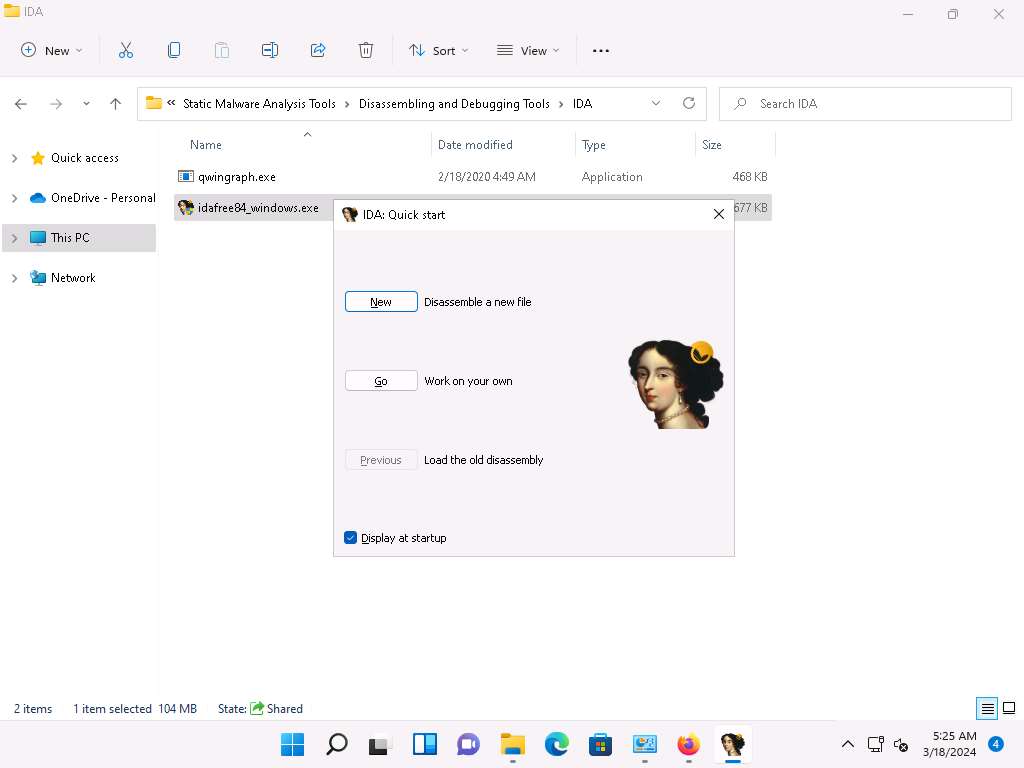
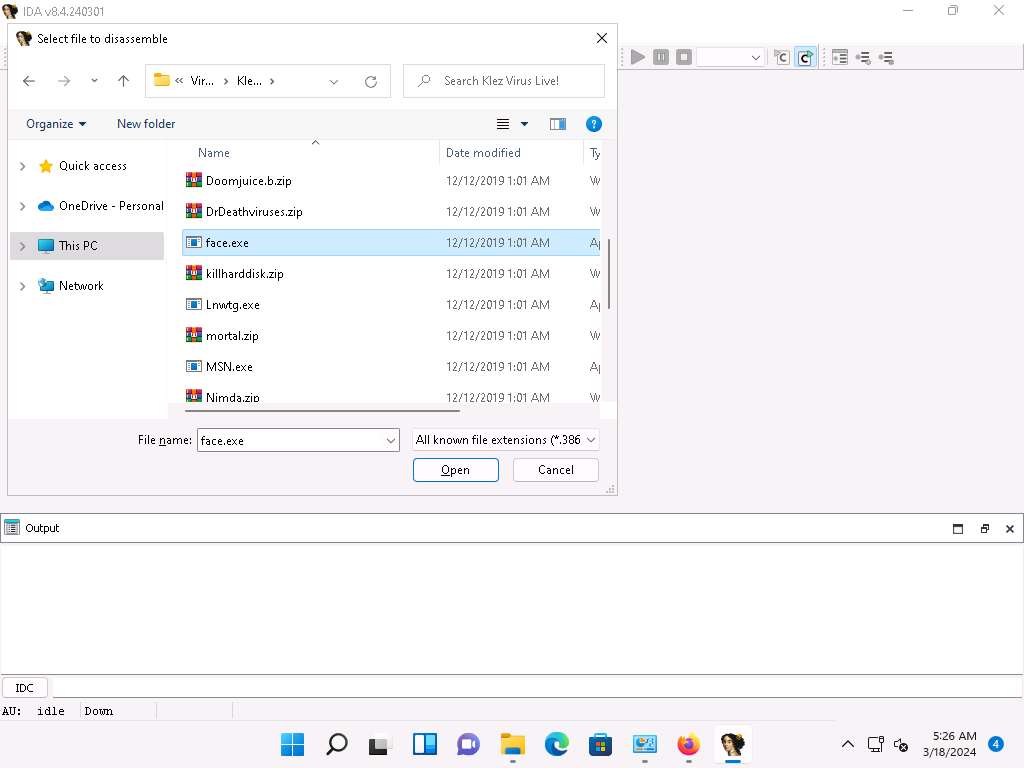
Screenshot The IDA main window appears, along with the Select file to disassemble window.
In the Select file to disassemble window, select face.exe, and click Open.
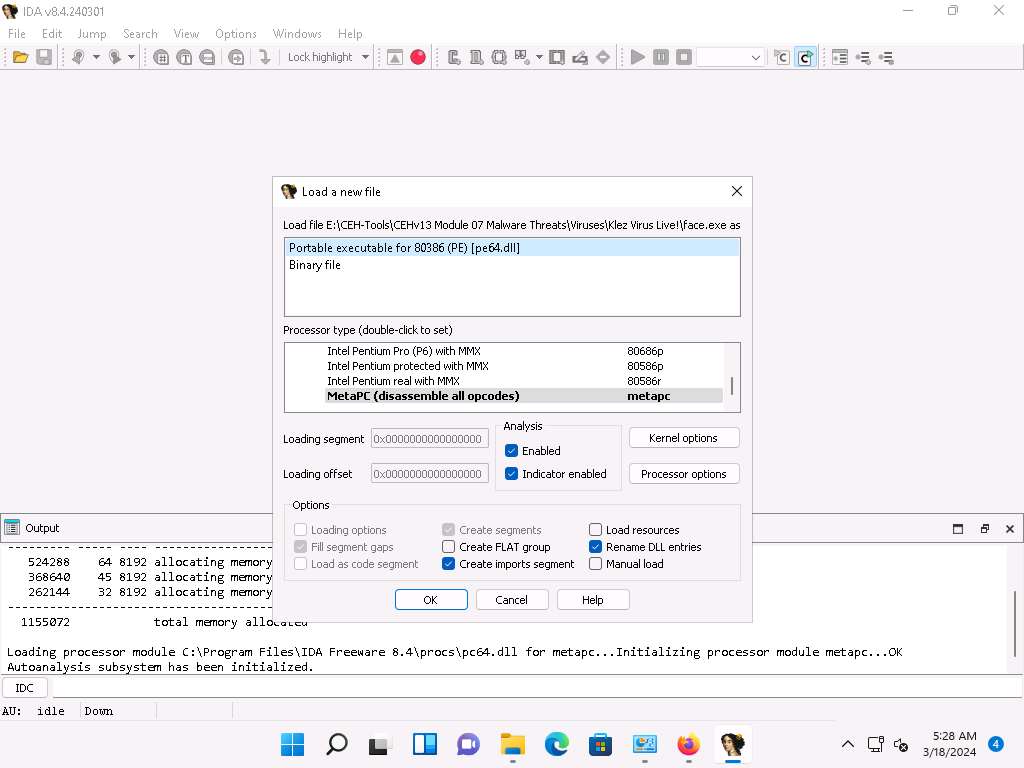
Screenshot The Load a new file window appears; by default, the Portable executable for 80386 (PE) [pe64.dll] option selected; click OK.
Screenshot If a Warning pop-up appears, click OK.
If a Please confirm dialog-box appears, read the instructions carefully, and then click Yes.
IDA completes the analysis of the imported malicious file and displays the results in the IDA View-A tab, as shown in the screenshot.
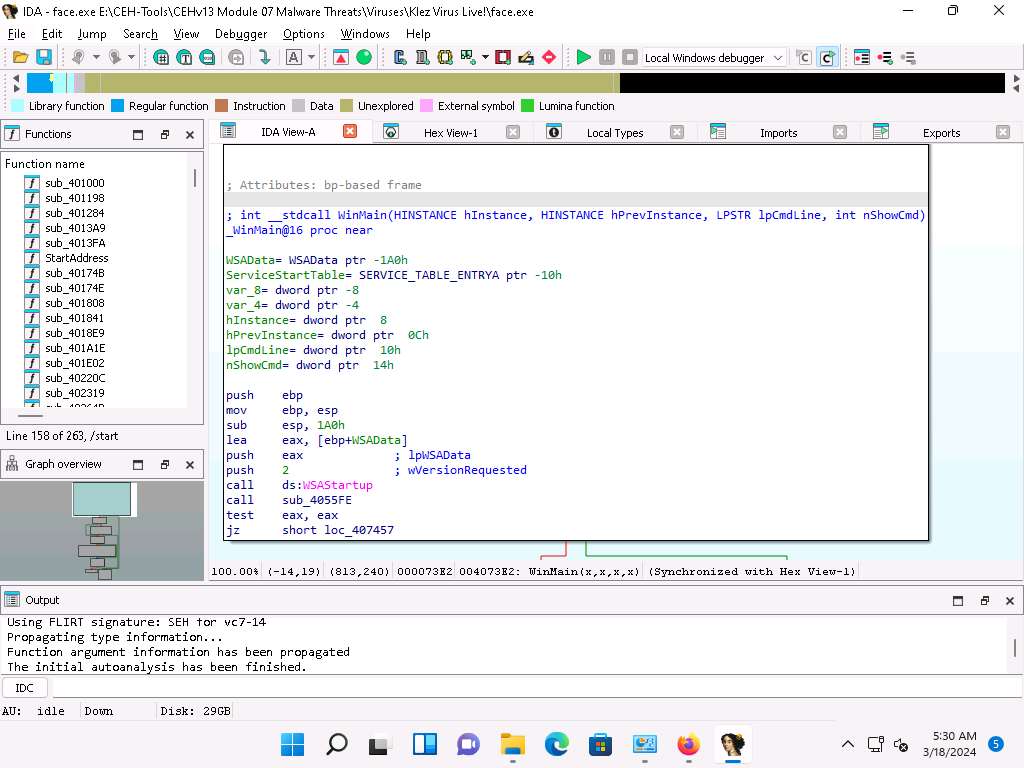
Screenshot In the IDA View-A section, right-click anywhere and choose Text view from the context menu to view the text information of the malicious file uploaded to IDA for analysis.
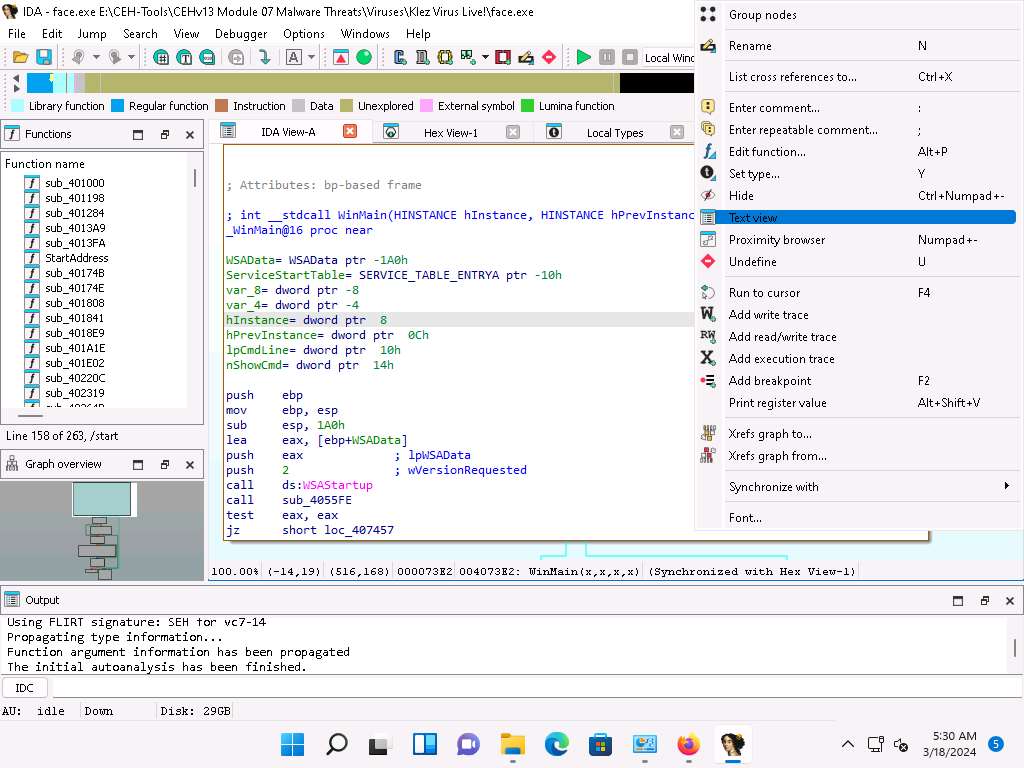
Screenshot This reveals the text view of the malicious file, allowing analysis of its information.
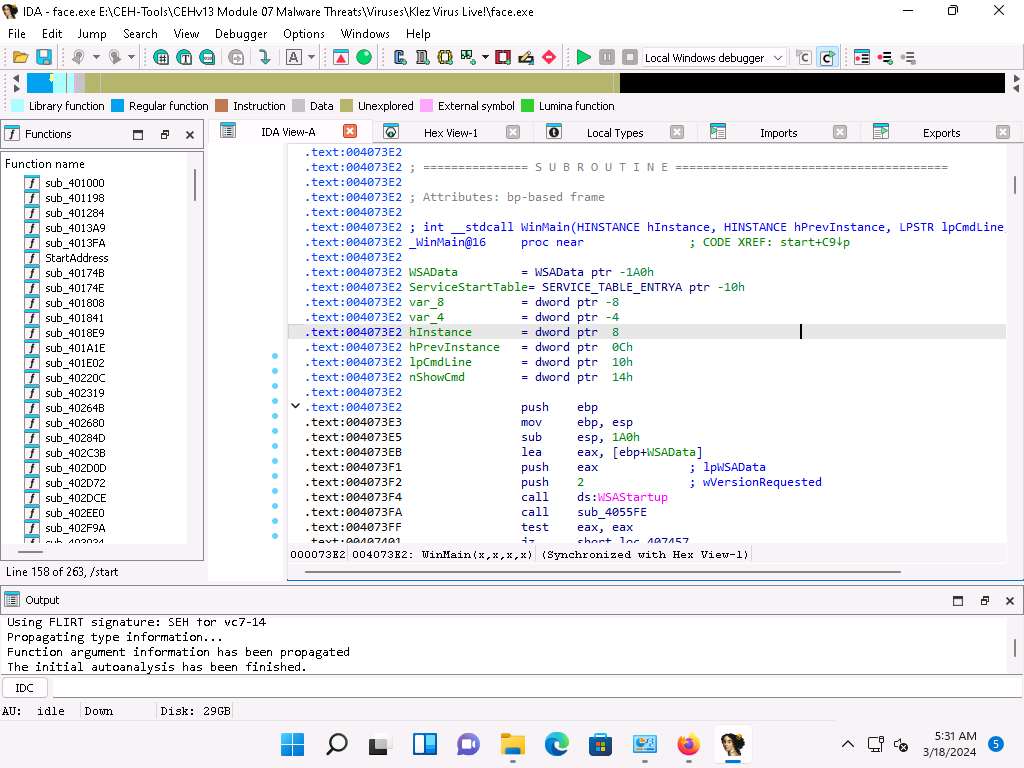
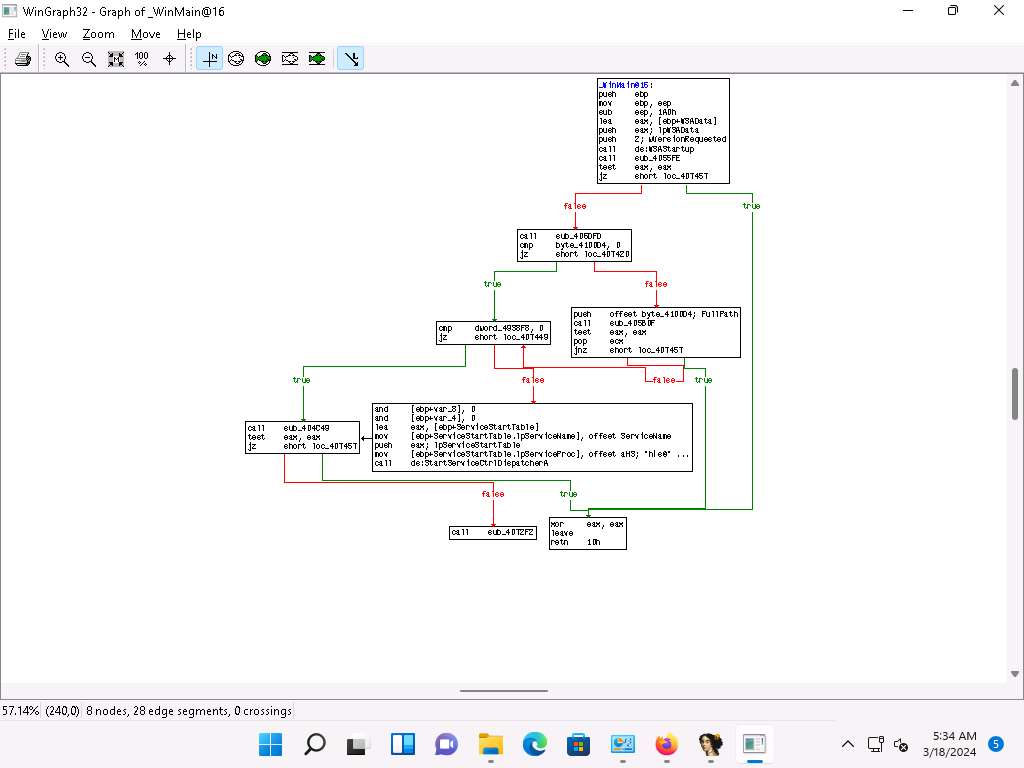
Screenshot Maximize the IDA window. To view the flow of the uploaded malicious file, navigate to View --> Graphs and click Flow chart.
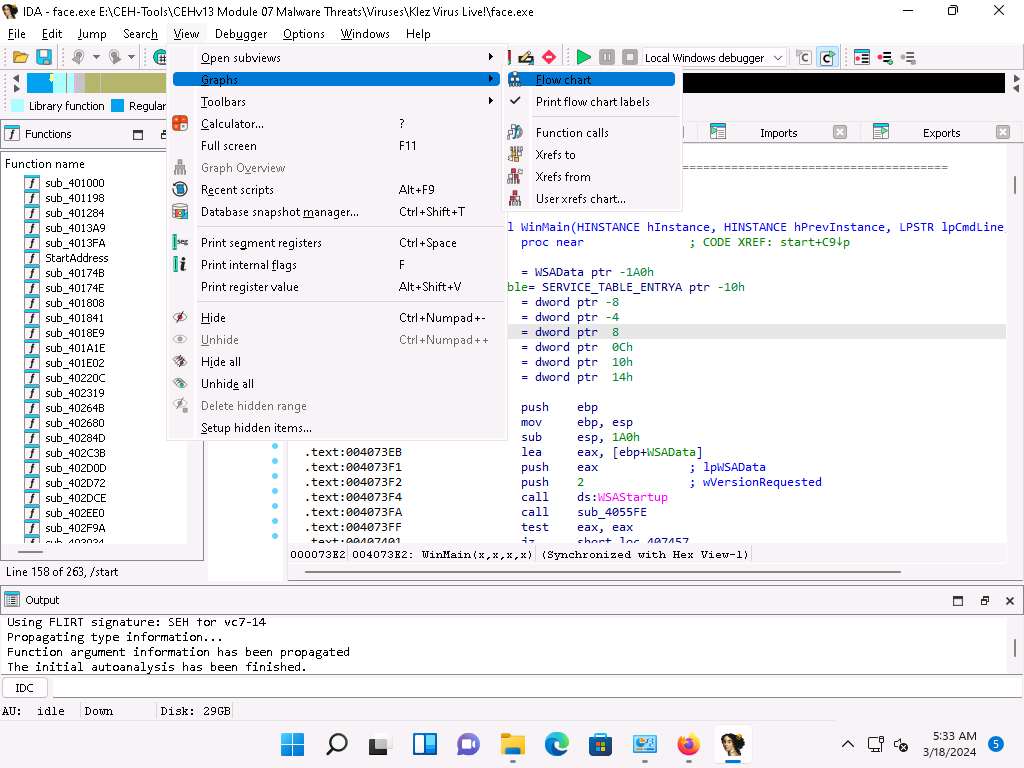
Screenshot A Graph window appears with the flow. You may zoom in and adjust the screen to view this more clearly.
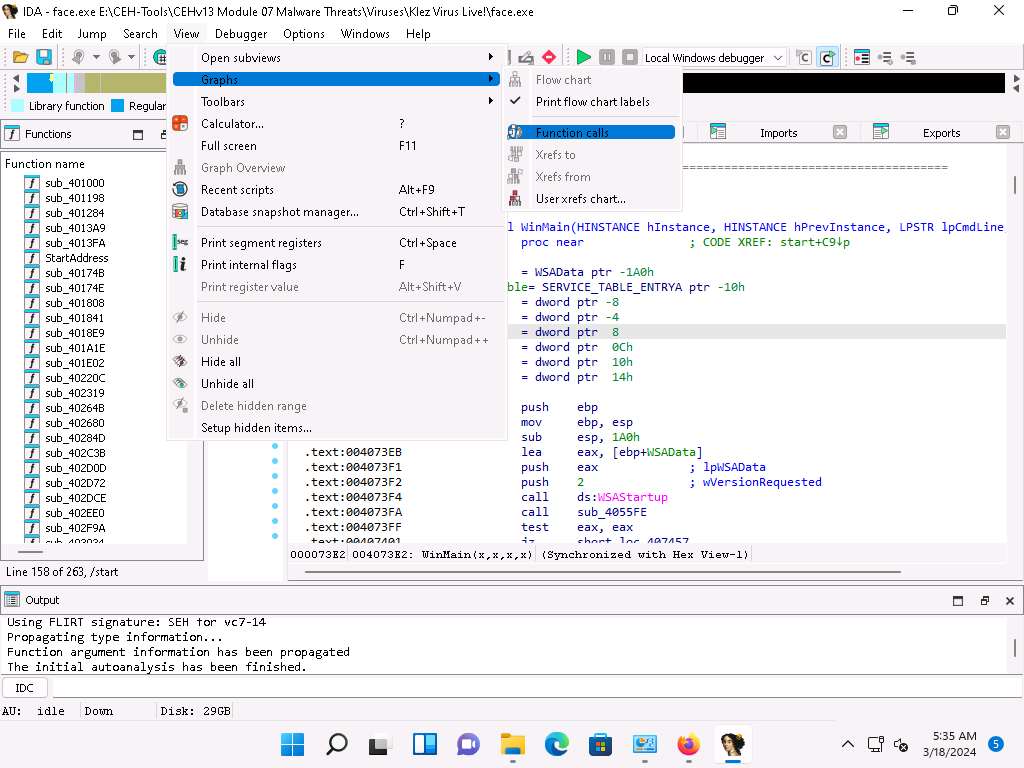
Screenshot Close the Graph window, go to View --> Graphs, and click Function calls from the menu bar.
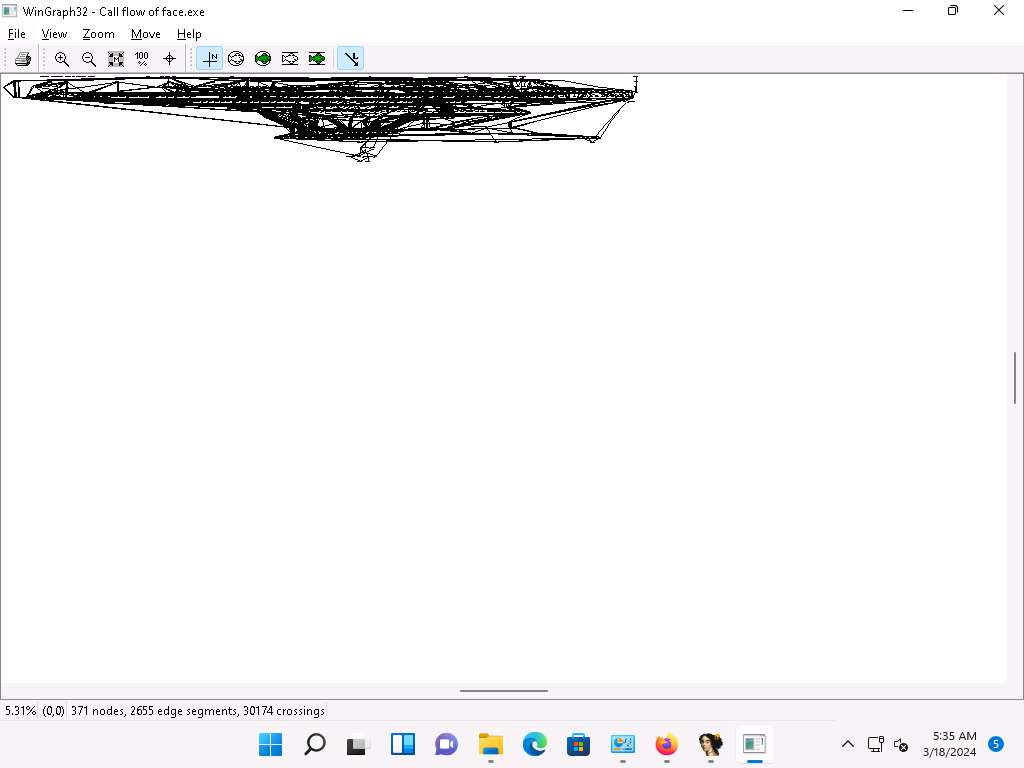
Screenshot A window showing call flow appears; zoom in for a better view. Close the WinGraph32 Call flow window after completing the analysis.
Screenshot 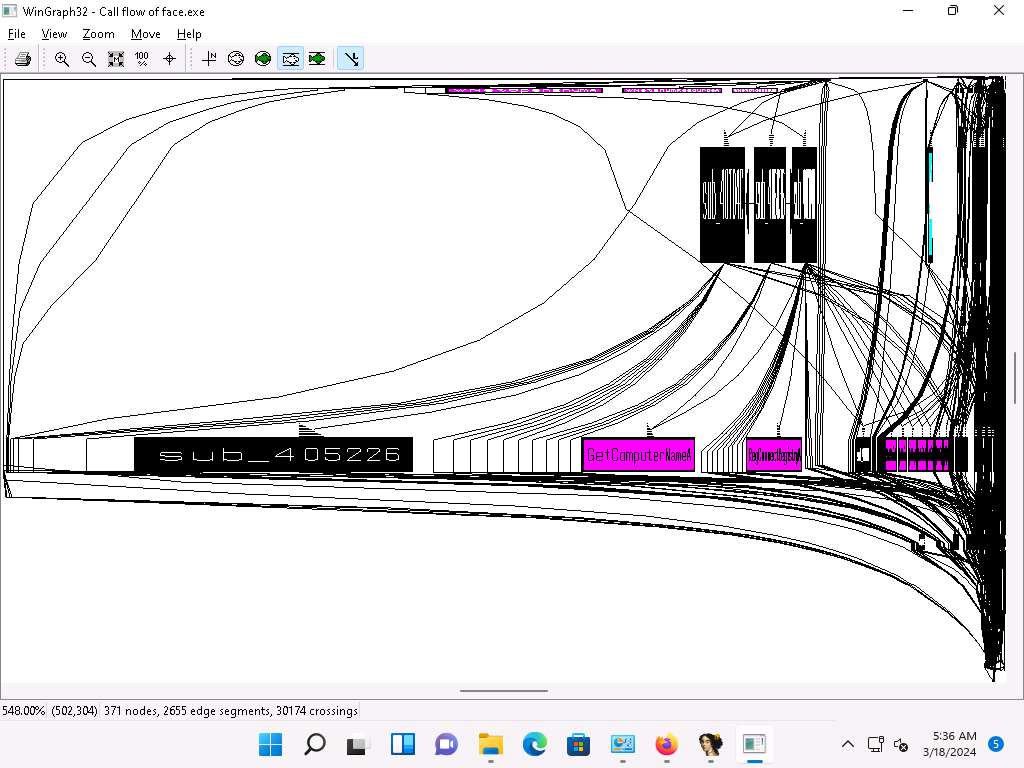
Screenshot Click the HexView-1 tab to view the hex value of the malicious file.
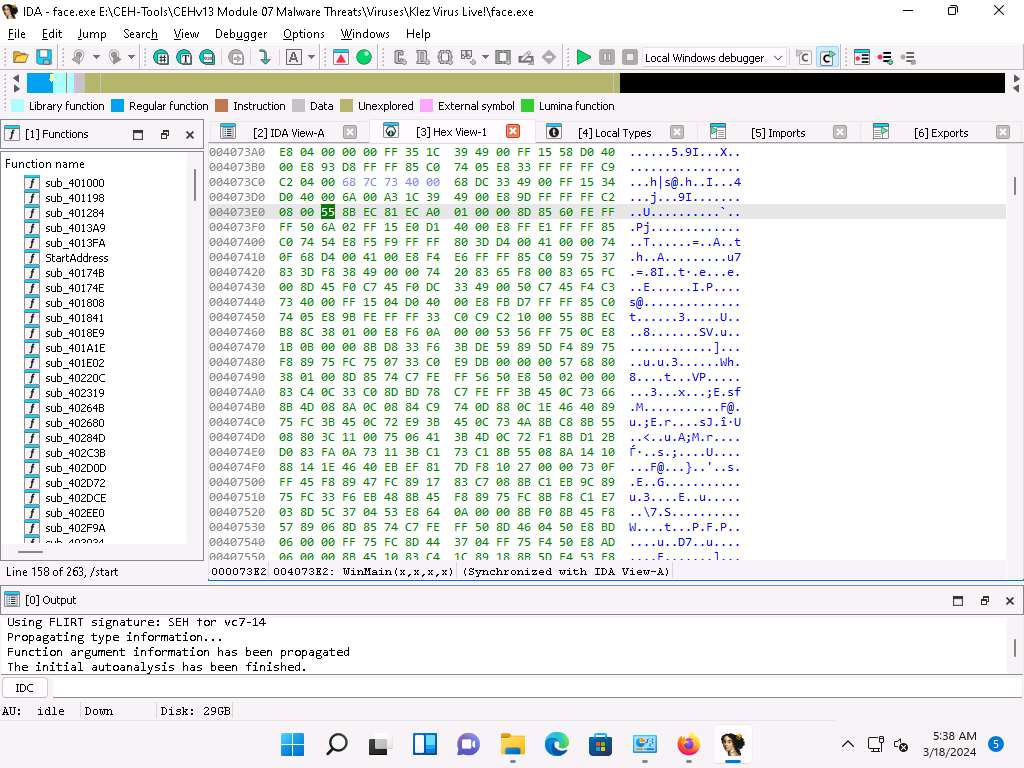
Screenshot Click the Imports tab to view list of all functions that the executable calls.
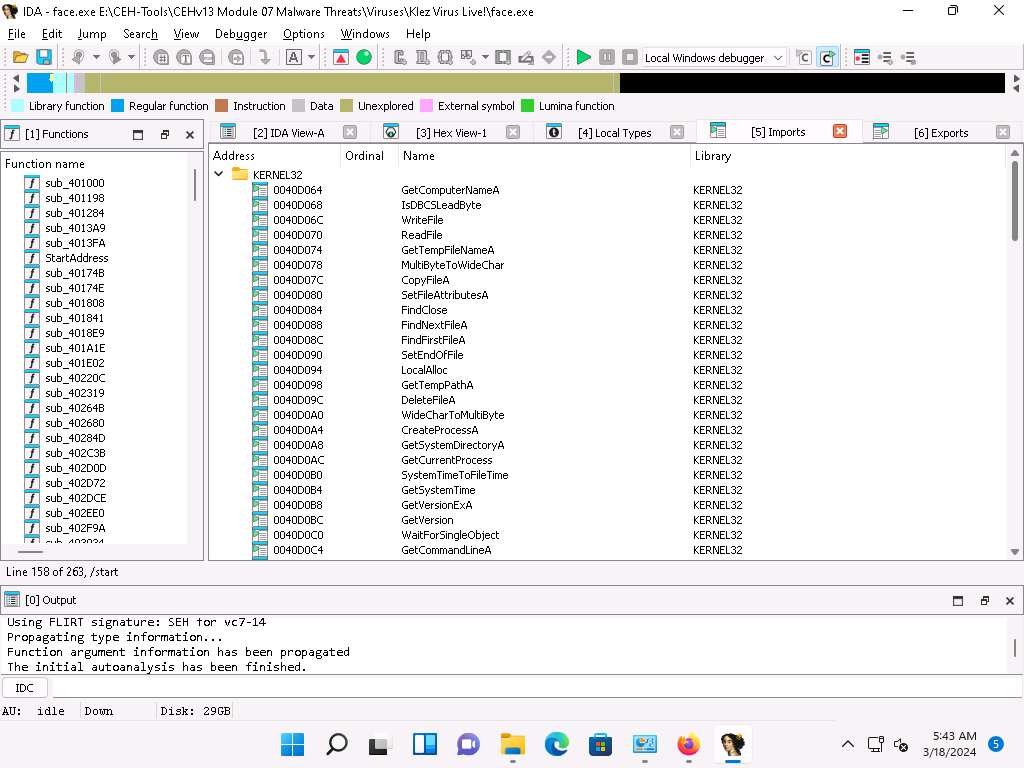
Screenshot Close all open windows. In the Save database pop-up, click OK.
Navigate to Ollydbg.exe.
If an Open File - Security Warning pop-up appears, click Run.
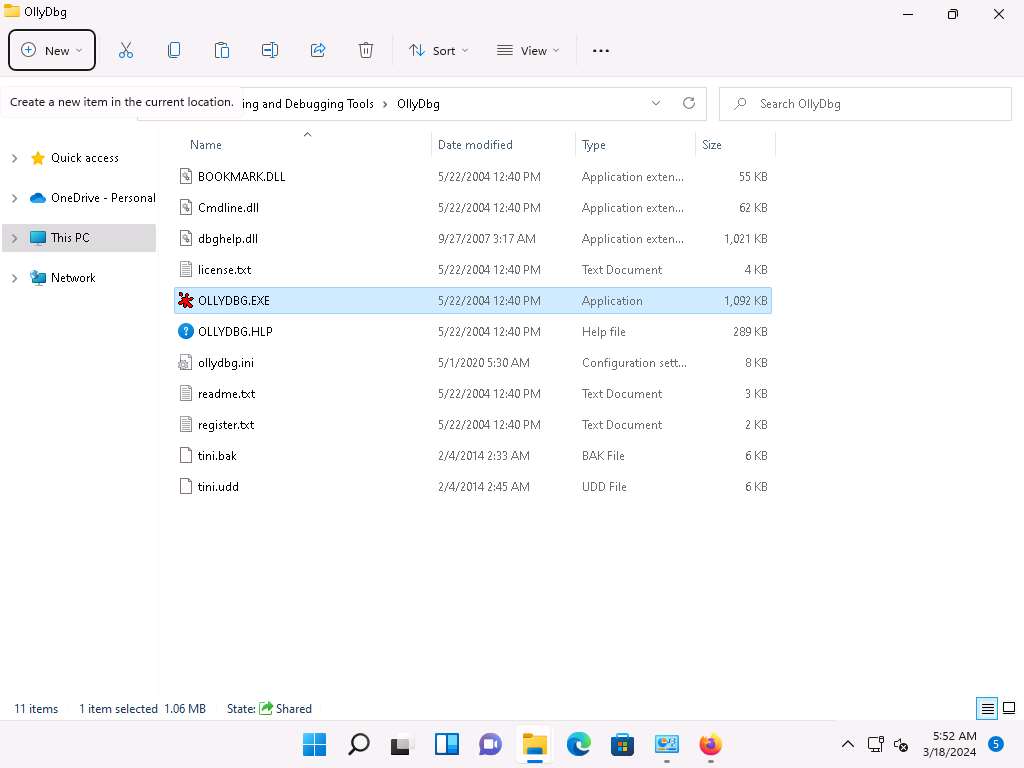
Screenshot If a Old DLL dialog box appears, click Yes.
If an OllyDbg warning message appears, for administrative rights, click OK.
The OllyDbg main window appears, as shown in the screenshot.
When you launch OllyDbg for the first time, several sub-windows might appear in the main window of OllyDbg; close all of them.
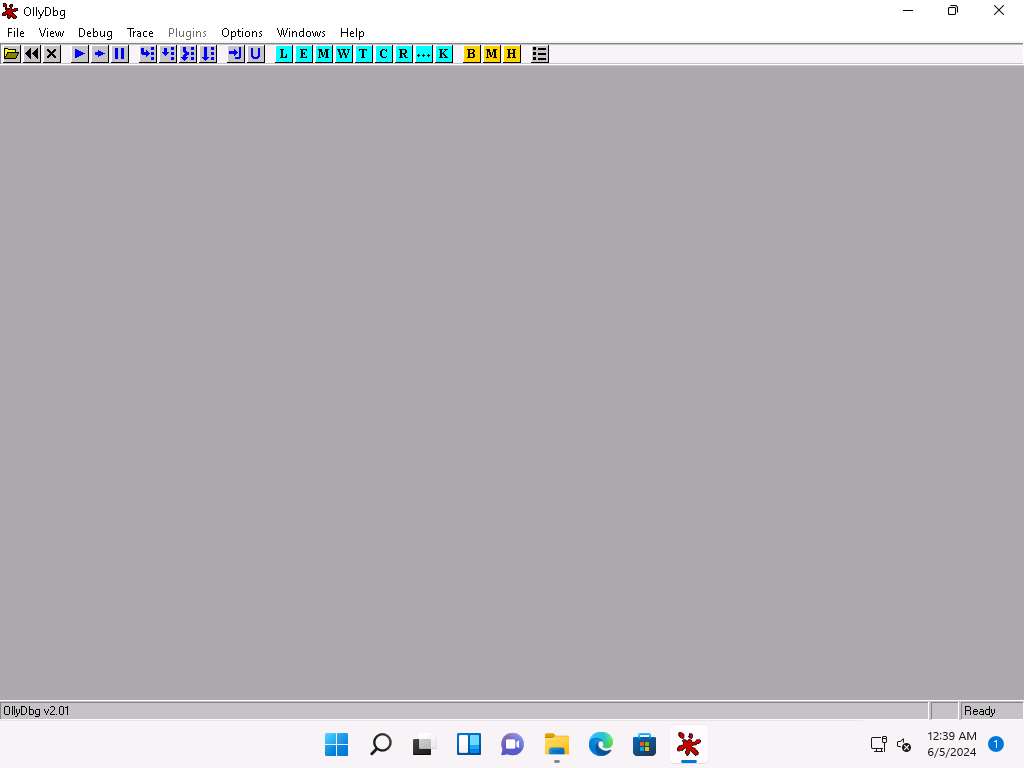
Screenshot Choose File from the menu bar, and then choose Open.
The Select 32-bit executable, select tini.exe, and click Open.
The output appears in a window named CPU - main thread, module tini, maximize the window.
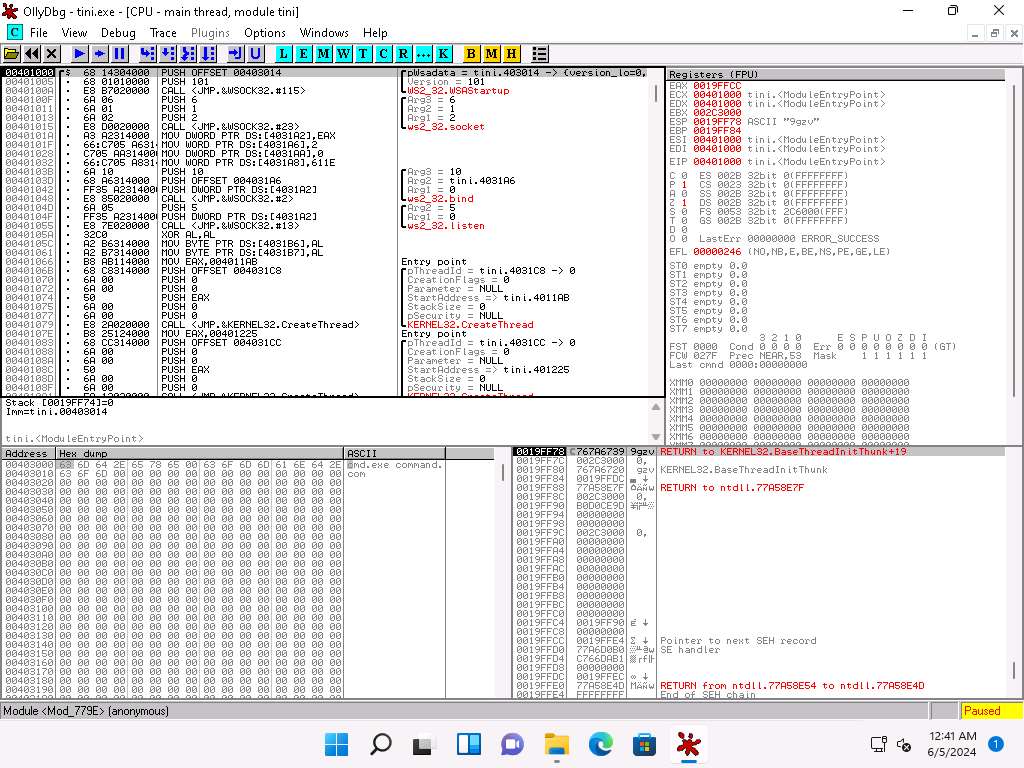
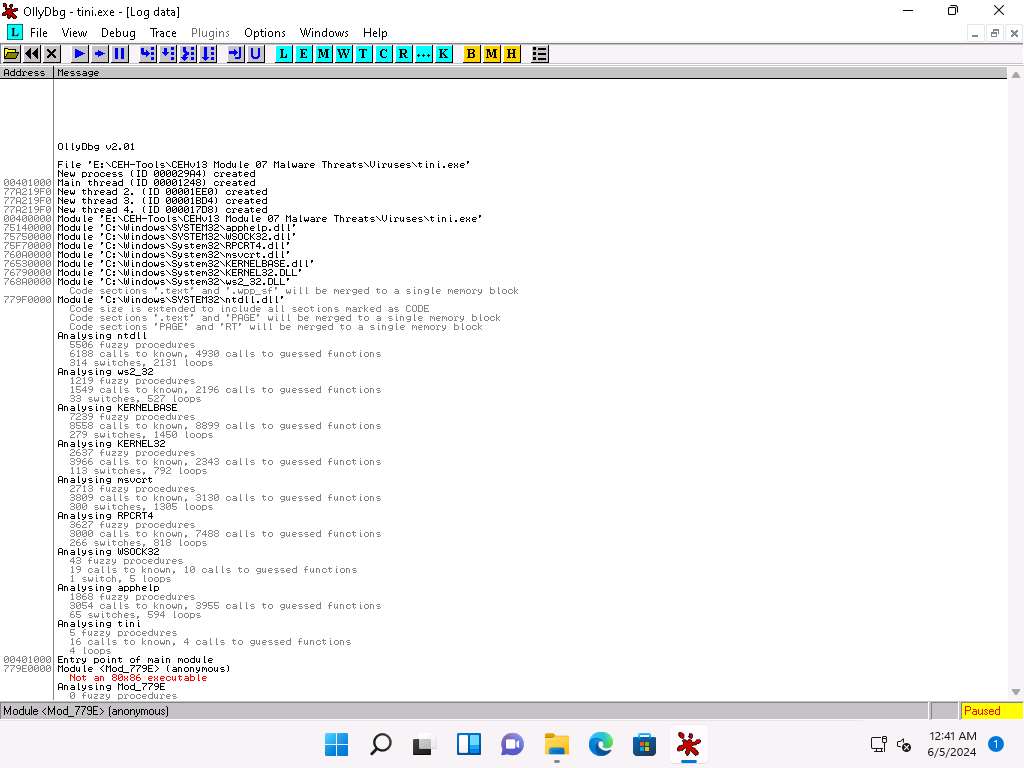
Screenshot Choose View in the menu bar, and then choose Log.
A window named Log data appears in OllyDbg, displaying the log details.
The Log data also displays the program entry point and its calls to known functions. Close the Log data window after completing the analysis.
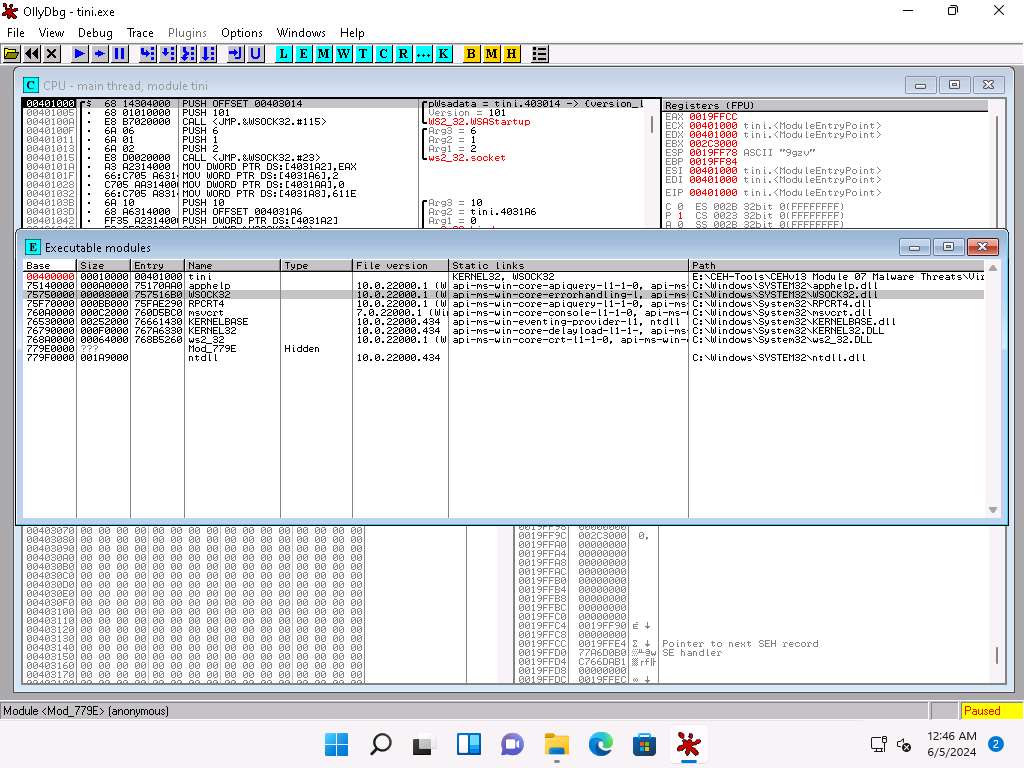
Screenshot Choose View in the menu bar, and then choose Executable modules.
A window named Executable modules appears in OllyDbg, displaying all executable modules.
Double-click any module to view the complete information of the selected module.
In this task, we are choosing the 75750000 module. The results might differ when you perform this task.
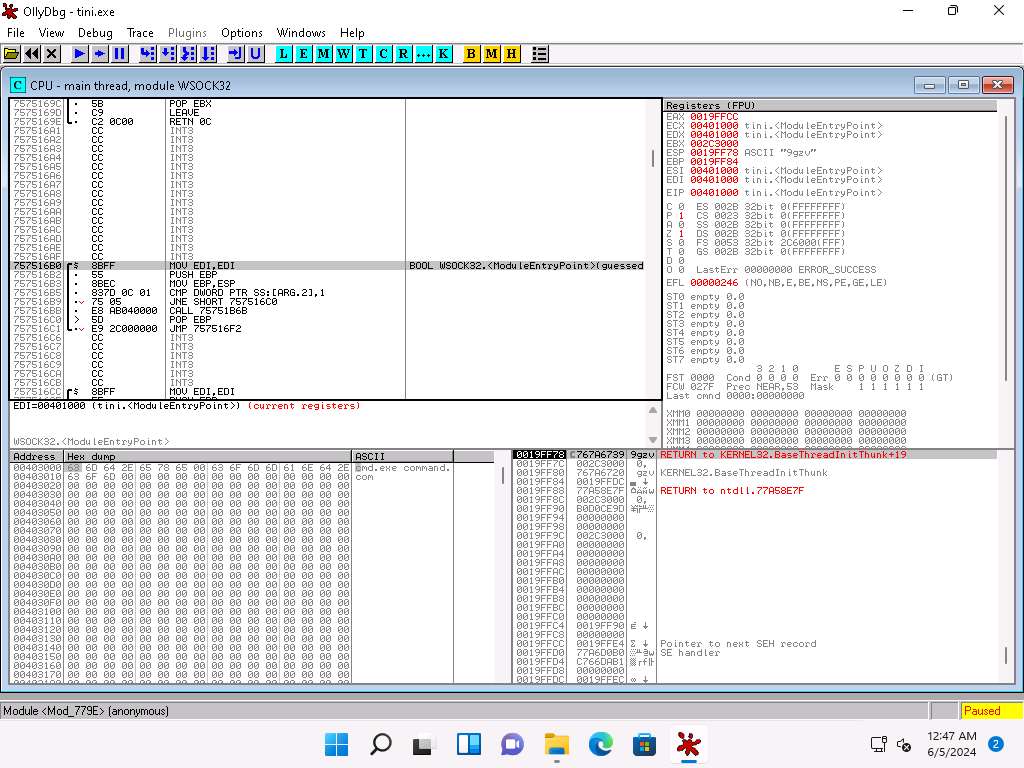
Screenshot This will redirect you to the CPU - main thread window, as shown in the screenshot.
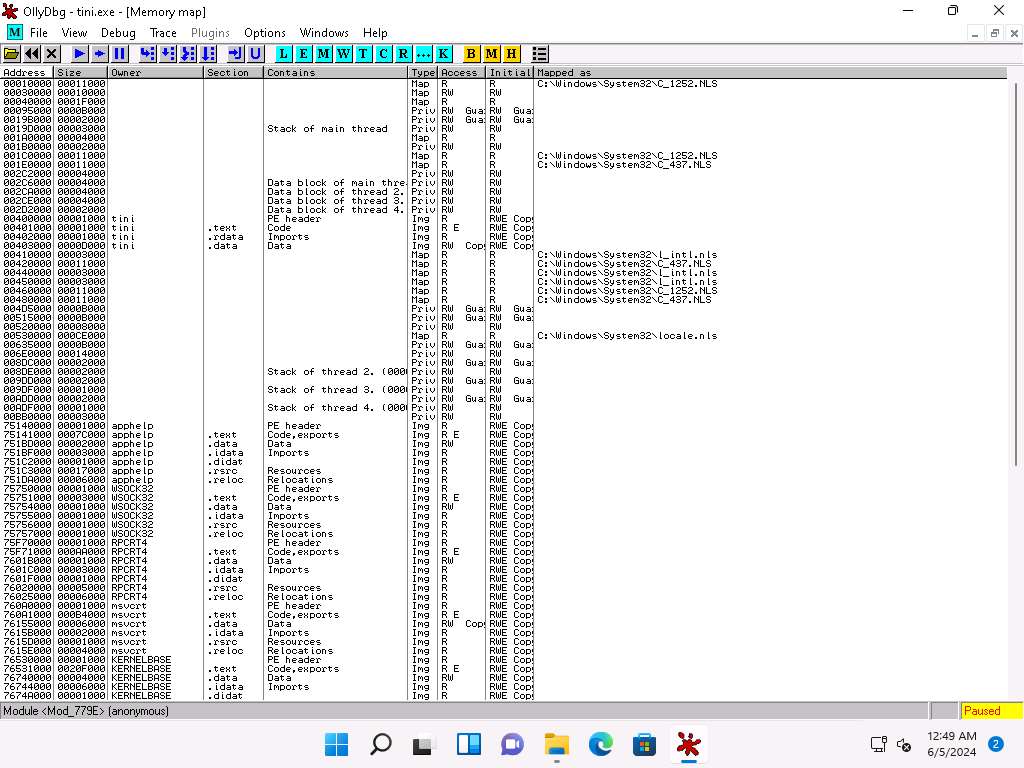
Screenshot Choose View in the menu bar, and then choose Memory map.
A window named Memory map appears in OllyDbg, displaying all memory mappings, as shown in the screenshot. Close the Memory map window.
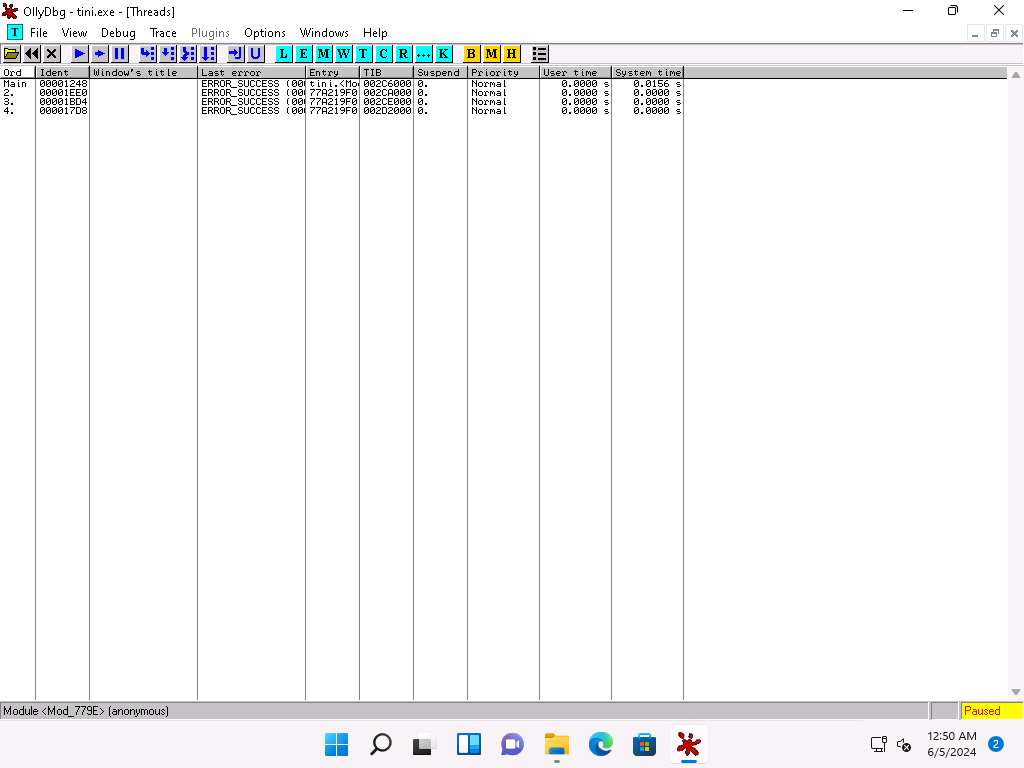
Screenshot Choose View in the menu bar, and then choose Threads.
A window named Threads appears in OllyDbg, displaying all threads, as shown in the screenshot.
Screenshot This way, you can scan files and analyze the output using OllyDbg.
8. Malware disassembly using Ghidra
Ghidra is a software reverse engineering (SRE) framework that includes a suite of full-featured, high-end software analysis tools that enable users to analyze compiled code on a variety of platforms including Windows, MacOS, and Linux. It's capabilities include disassembly, assembly, decompilation, debugging, emulation, graphing, and scripting. Ghidra supports a wide variety of processor instruction sets and executable formats and can be run in both user-interactive and automated modes. Analysts can also develop their own Ghidra plug-in components and/or scripts using the exposed API. In addition, there are numerous ways to extend Ghidra such as new processors, loaders/exporters, automated analyzers, and new visualizations.
CEH v13 Practical Full Course
Last updated